You're staring at inconsistent coating quality that's costing you customer complaints and rework. Without proper viscosity control, you're essentially guessing at your formulation consistency rather than knowing it with certainty.
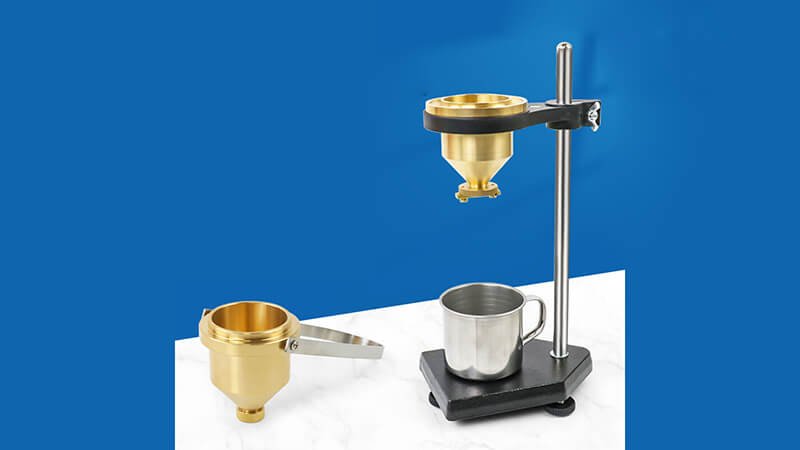
A viscosity cup is a simple yet precise tool for measuring liquid flow properties. By timing how quickly a fluid flows through a calibrated orifice, you can quantify viscosity and ensure batch-to-batch consistency in paints, coatings, inks, and other industrial fluids.
I've been supplying viscosity measurement equipment for over 15 years, and I've seen how proper viscosity cup technique transforms quality control from subjective assessment to reliable science. Let me walk you through the correct procedure to get consistent results every time.
Step 1: How to prepare your sample and equipment?
Many operators get inconsistent readings because they rush into testing without proper preparation. Temperature variations and contamination are the silent killers of measurement accuracy.
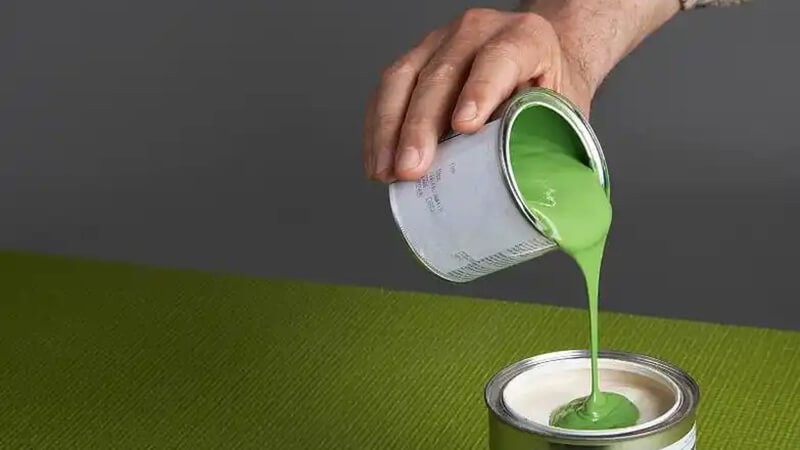
Before testing, ensure your sample is at the required temperature (typically 25°C) and thoroughly mixed without air bubbles. Select the appropriate cup size for your expected viscosity range, and check that the cup is clean, dry, and undamaged with no obstructions in the orifice.
Proper preparation makes all the difference between reliable and questionable results. Here's what I recommend based on years of helping clients improve their testing protocols:
Sample and Equipment Preparation Essentials
Temperature control is particularly critical since viscosity is highly temperature-dependent. I've worked with coating manufacturers who discovered that a mere 5°C difference in sample temperature caused up to 20% variation in their viscosity readings!
| Preparation Step | Key Points | Common Mistakes to Avoid |
|---|---|---|
| Temperature Control | Maintain sample at specified temperature (usually 25°C) | Testing immediately after removing from storage without temperature equilibration |
| Sample Mixing | Mix thoroughly but gently to avoid air entrainment | Aggressive stirring that introduces air bubbles |
| Cup Selection | Choose correct cup size/type based on expected viscosity | Using the same cup for all materials regardless of viscosity range |
| Cup Inspection | Check for damage, particularly around the orifice | Ignoring minor dents or scratches that affect flow geometry |
| Cup Cleaning | Clean with appropriate solvent and dry completely | Insufficient drying leading to solvent contamination |
| Leveling | Ensure testing surface is level | Testing on uneven surfaces causing flow bias |
I once helped a client troubleshoot wildly inconsistent readings only to discover they were testing samples straight from cold storage. Implementing a simple water bath for temperature equilibration improved their measurement repeatability dramatically.
Step 2: How to fill and position the viscosity cup?
The most common mistakes happen during the cup filling stage. Improper technique here introduces variables that undermine the entire measurement.
Submerge the cup completely in the well-mixed sample, then lift it vertically in one smooth motion. Hold the cup approximately 6 inches (15 cm) above the sample container. Start your timer the moment the fluid stream begins flowing from the orifice.
The consistency of your filling technique directly impacts measurement reliability. I've developed this approach through years of training quality control technicians:
Mastering the Filling and Positioning Technique
The way you handle the cup might seem trivial, but it significantly affects results. When I train operators, I emphasize these critical aspects:
| Technique Element | Correct Method | Why It Matters |
|---|---|---|
| Submersion Depth | Completely submerge cup below fluid surface | Ensures complete filling without air pockets |
| Lifting Motion | Smooth, vertical lift without tilting | Prevents premature flow and ensures complete filling |
| Holding Position | Approximately 15 cm above container | Maintains consistent flow conditions |
| Cup Orientation | Perfectly level | Ensures even pressure on the orifice |
| Hand Position | Hold by rim or handle, fingers away from orifice | Prevents heat transfer and flow obstruction |
| Timing Start | Begin timing the moment flow starts from orifice | Consistency in measurement starting point |
During a factory audit I conducted last year, I discovered operators were holding cups at different heights—ranging from 5 to 30 cm above containers. This simple inconsistency was causing a 15% variation in their readings! Standardizing this one aspect of their procedure brought immediate improvements to their process control.
Step 3: How to measure and record flow time?
Even with perfect preparation and filling, timing errors can undermine your results. Precision in this step separates professional quality control from amateur guesswork.
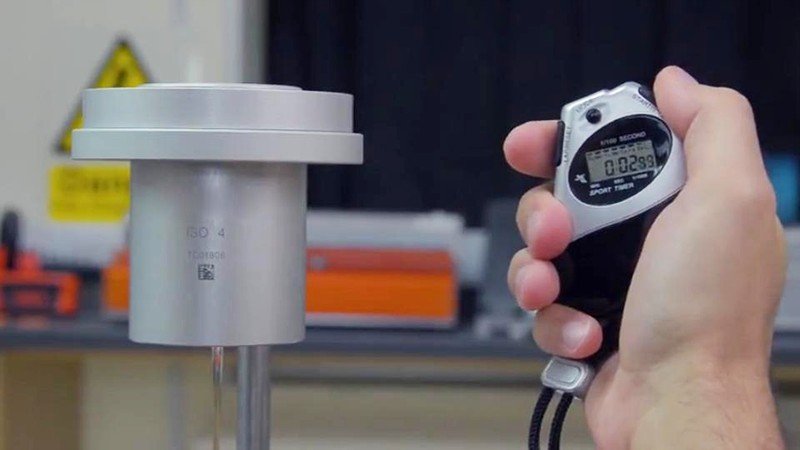
Start your stopwatch the instant fluid begins flowing from the orifice. Watch carefully and stop timing at the first break in the fluid stream. Record the time in seconds to at least one decimal place. For critical applications, repeat measurements 2-3 times and average the results.
Accurate timing is essential for meaningful results. Here's how to ensure you're getting reliable measurements:
Perfecting Your Timing Technique
Timing precision directly affects measurement quality. In my training sessions, I focus on these critical elements:
| Timing Element | Best Practice | Precision Impact |
|---|---|---|
| Starting Point | Start timing at first appearance of flow from orifice | Eliminates variation from delayed starts |
| Endpoint Recognition | Stop at first definite break in continuous stream | Provides consistent endpoint reference |
| Timer Precision | Use a digital timer with 0.1 second precision | Improves repeatability of measurements |
| Observer Position | Position yourself at eye level with the cup bottom | Improves visual accuracy for start/stop points |
| Lighting | Ensure good lighting to clearly see the flow stream | Reduces endpoint interpretation errors |
| Repetition | Perform at least three measurements and average | Reduces impact of timing reaction variations |
I remember working with a client who couldn't understand why their quality control results didn't match their production outcomes. The issue was simple—their operators were using different endpoints for timing. Some stopped at the first break in flow, while others continued until the last drop. Standardizing on the first definite break in continuous flow solved their consistency issues.
Step 4: How to interpret and apply your results?
Taking measurements without proper interpretation wastes your time and leads to poor decision-making. This final step transforms raw data into actionable quality control.
Compare your flow time with your standard specifications or conversion charts. For direct viscosity values, use the cup manufacturer's conversion formulas or tables. Document temperature, cup type, and flow time. Use these results to make informed adjustments to your formulation or process.
The value of viscosity measurement lies in how you use the data to improve your process. From my experience helping clients implement effective quality control systems:
Translating Measurements into Quality Improvements
Proper interpretation turns measurements into process improvements. Here's how to make your data work for you:
| Interpretation Step | Approach | Business Impact |
|---|---|---|
| Specification Comparison | Compare results to established specifications | Ensures product meets quality requirements |
| Conversion to Absolute Units | Use conversion charts to translate flow time to centistokes/centipoise | Allows comparison with other measurement methods |
| Temperature Correction | Apply temperature correction if testing wasn't at standard temperature | Improves accuracy when temperature control is imperfect |
| Trend Analysis | Chart results over time to identify drift | Enables early intervention before quality issues occur |
| Process Adjustment | Determine required adjustments based on measurements | Maintains consistent product quality |
| Documentation | Record all parameters including temperature, cup type, and batch information | Supports traceability and process improvement |
One manufacturer I worked with transformed their operation by creating a simple spreadsheet that tracked viscosity cup readings against production variables. Within months, they identified patterns that allowed them to reduce variability by 40% and customer complaints by nearly 60%.
Conclusion
Mastering viscosity cup measurement requires attention to sample preparation, proper filling technique, precise timing, and thoughtful interpretation of results. By following these four steps consistently, you'll gain reliable data for better quality control and process improvement.