
Is your product's viscosity a mystery? A single viscosity number doesn't tell the whole story. This can lead to unexpected problems during production or when your customer uses it.
A viscosity flow curve is a graph that shows how a fluid's viscosity changes as the shear rate (force) applied to it changes. This data helps predict how the material will behave during pumping, mixing, and application.
At Martests, we often talk with customers who need to understand more than just a single viscosity number. They need to know how their product will act in the real world. A flow curve gives you that full picture. It's like having a complete roadmap for your fluid's behavior instead of just one signpost. I'm going to walk you through how these curves are made, what they mean, and why they are so valuable for your business.
How Are Flow Curves Measured and Plotted?
Do you rely on single-point viscosity tests? This can hide crucial flow behavior, leading to unexpected processing problems. Let's explore a much better method.
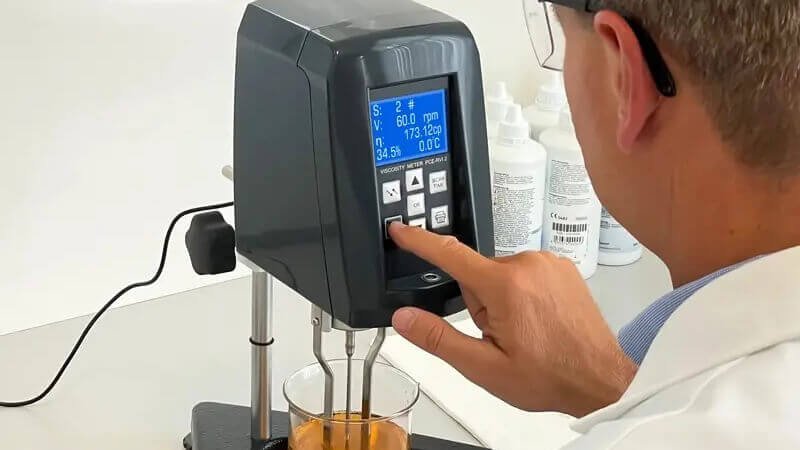
Flow curves are measured using rotational viscometers or rheometers. These instruments apply a range of rotational speeds (shear rates) to a sample and record the resulting resistance (shear stress) to plot the curve.
To get a flow curve, you need an instrument that can test a sample at many different speeds. This is different from a simple viscometer that only tests at one speed. We use rotational viscometers, like our cone and plate models, or more advanced rheometers for this job. The instrument's spindle spins in the liquid at various programmed speeds. Each speed is a different shear rate. At each speed, the instrument measures the torque, or force, needed to keep it spinning. This force is the shear stress. The instrument’s software then calculates the viscosity at each point and plots it on a graph. This graph is your flow curve.
Newtonian Fluids
For some simple fluids, like water or oil, the viscosity is always the same no matter how fast you stir them. These are called Newtonian fluids. Their flow curve is just a flat, horizontal line.
Non-Newtonian Fluids
Most complex fluids, like paint, ketchup, or creams, are non-Newtonian. Their viscosity changes with the shear rate. Their flow curve will be sloped or curved. This is why a full curve is so important for these materials.
What Typical Flow Behaviors Do These Curves Reveal?
Is your product too thick to pump but too thin when applied? A flow curve can explain this confusing behavior and help you finally fix it.
Flow curves reveal key behaviors like shear-thinning (viscosity decreases with force), shear-thickening (viscosity increases with force), and yield stress (the minimum force needed to start flow). This helps predict how a material behaves in real life.
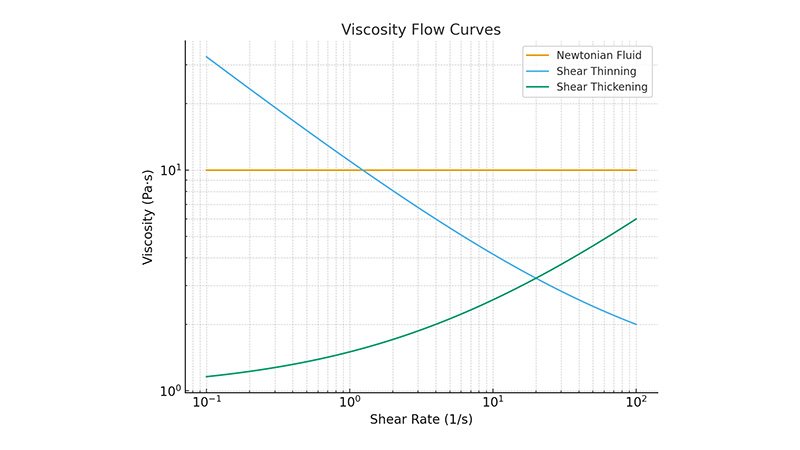
The shape of the flow curve tells you a story about your material. There are three main behaviors you will see. Understanding them is key to controlling your product.
Shear-thinning
This is the most common behavior in industrial products. Shear-thinning fluids get thinner as you apply force. Think about paint. It is thick in the can so it doesn't drip off the brush, but it thins out as you apply it to the wall for smooth spreading. Ketchup is another great example. It stays put on your plate but flows easily when you shake the bottle.
Shear-thickening
This behavior is less common but still important. Shear-thickening fluids get thicker as you apply force. A classic example is a mixture of cornstarch and water. If you stir it slowly, it's a liquid. If you try to stir it quickly, it becomes almost solid. This property is used in some specialized applications like liquid body armor.
Yield Stress
This is the amount of force needed to get a material to start flowing at all. Think about toothpaste or mayonnaise. It sits on your toothbrush or knife without moving. It has a high yield stress. You have to apply a certain amount of force (squeezing the tube or spreading with the knife) before it starts to flow like a liquid.
What Are the Steps to Create a Flow Curve?
Unsure how to get from a sample to a useful flow curve? The process seems technical, but it is straightforward with the right instrument and method.
To create a flow curve, you prepare your sample, select the correct spindle and speed range on a rotational viscometer, run a stepped test from low to high shear rate, and then plot viscosity against shear rate.
Creating a reliable flow curve involves a few simple, but important, steps. I've helped many customers, including distributors like Jacky in Italy, set up this process in their labs.
- Prepare the Sample. Your sample must be at the correct, stable temperature because temperature greatly affects viscosity. Also, make sure there are no air bubbles in the sample, as they can ruin the measurement.
- Set Up the Instrument. Choose the correct viscometer model and spindle for your sample's expected viscosity. For example, a cone and plate viscometer is excellent for getting very accurate shear rate data. Place the correct amount of sample in the instrument.
- Program the Test. In the instrument's software, you define the test parameters. You will set a range of shear rates (or rotational speeds, RPM) to test. A common method is a "stepped" test, where you start at a low speed, hold it for a short time, then step up to the next speed, and so on.
- Run the Measurement. Start the test. The viscometer will automatically run through the programmed speeds, measuring the torque at each step. This process might take a few minutes.
- Analyze the Data. The software will automatically calculate the viscosity for each shear rate. It then plots these points on a graph with viscosity on the vertical (Y) axis and shear rate on the horizontal (X) axis. This graph is your final flow curve.
What Are the Engineering Applications and Their Value?
Is your R&D process slow and based on trial and error? Flow curves provide predictive data that speeds up development and improves product quality across many industries.
In engineering, flow curves are vital for process design (pumping, mixing), quality control, and predicting end-use performance in industries like food, coatings, pharmaceuticals, and polymer processing, ensuring consistency and efficiency.
The real value of flow curves is in how you use them to solve real-world problems. They are essential across many industries for making better products and more efficient processes.
Food Industry
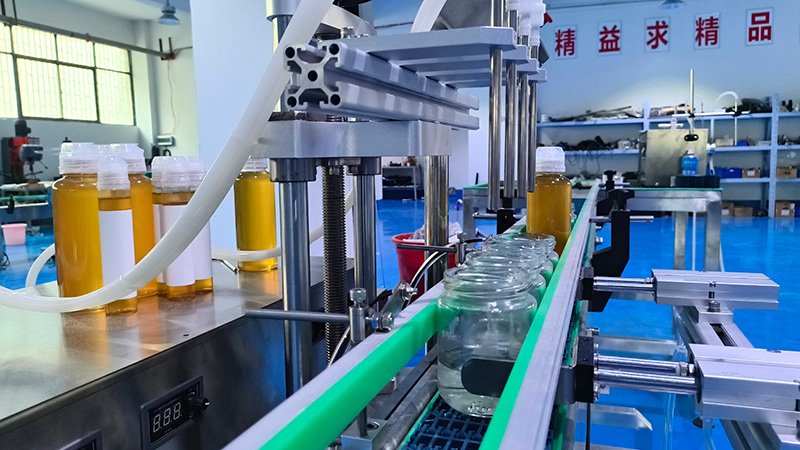
In food production, flow curves help formulate products like yogurt and ketchup. The data tells you how much energy is needed to pump them through pipes. It also predicts the "mouthfeel" and how the product will sit on a plate without running.
Coatings and Inks
For my customers in the paint industry, flow curves are critical. They use the data to design paints that are thick enough not to drip (high viscosity at low shear) but spread easily with a brush or roller (low viscosity at high shear).
Pharmaceutical Industry
In pharmaceuticals, flow curves ensure that creams and ointments are easy to squeeze from a tube and spread on the skin. They also help in formulating liquid medicines, making sure the active ingredients stay suspended evenly and don't settle at the bottom of the bottle.
Polymer Processing
When manufacturing plastic parts with injection molding or extrusion, flow curves of the molten polymer are essential. The data helps engineers predict how the plastic will flow into the mold, ensuring the final part is free of defects.
Conclusion
Flow curves offer deep insight into fluid behavior, far beyond a single viscosity point. Mastering them helps you control product quality and optimize processes for much better performance.