Your rubber compound's properties keep varying batch to batch, causing production delays and quality issues. Without understanding the rheometer curve, you're making costly decisions based on incomplete data.
A rheometer curve for rubber shows how the material's properties change during curing. The curve tracks torque over time, revealing key processing parameters like minimum viscosity (ML), maximum viscosity (MH), scorch time, and cure rate - essential data for consistent production.
As someone who has supplied testing equipment to rubber manufacturers for over 20 years, I've seen how critical rheometer curves are for quality control. Let me walk you through how to read and use these curves to optimize your rubber processing.
What Is a Rheometer Graph?
Looking at a rheometer curve for the first time can be overwhelming. All those lines and numbers seem confusing, making you hesitate to rely on the data for production decisions.
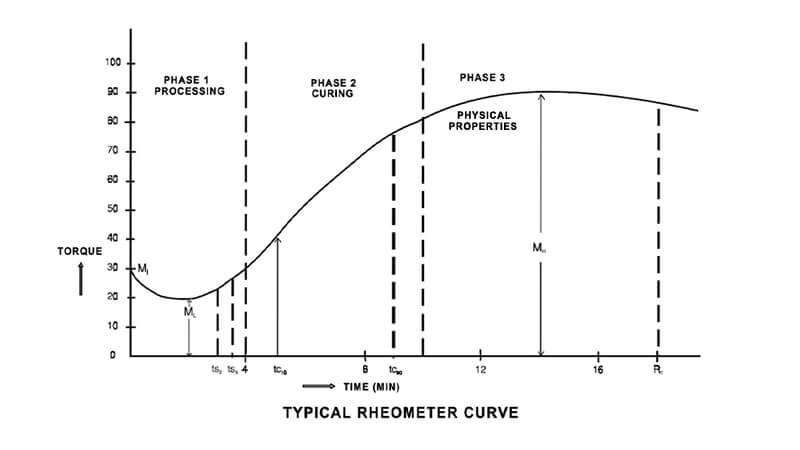
A rheometer graph plots torque (resistance to flow) against time as rubber cures. The resulting S-shaped curve shows three key phases: the initial softening, the curing reaction, and the final properties plateau. This visual representation makes complex curing behavior easy to understand.
When I train new customers on our equipment, I explain that reading a rheometer curve is like reading a story about your rubber compound. Each part of the curve reveals something important about how the material will behave during processing:
Understanding the Key Sections
The rheometer curve typically shows three distinct regions:
| Phase | What You See | What It Means |
|---|---|---|
| Initial Period | Sharp drop in torque | Material softening from heat |
| Curing Period | Rapid torque increase | Cross-linking reaction starting |
| Final Period | Leveling off | Cure completion and final properties |
This data helps you optimize mixing times, adjust cure temperatures, and predict final product properties before starting full production.
What Is the Rheometer Curve of Rubber?
Sometimes manufacturers misinterpret curve features or miss important warning signs, leading to production problems that could have been prevented.
The rheometer curve of rubber is a real-time graph showing how the material transforms from a soft, processable compound into a strong, elastic finished product. Each point on the curve corresponds to a specific stage in this transformation process.
Drawing from my experience working with rubber manufacturers, I've found that understanding five key points on the curve is essential:
Critical Points on the Curve
- ML (Minimum Torque) - Shows how easily the rubber flows when hot
- ts2 (Scorch Time) - Indicates when curing begins
- t90 (Optimal Cure Time) - Shows when the product reaches 90% of full cure
- MH (Maximum Torque) - Reveals final product stiffness
- CRI (Cure Rate Index) - Tells how fast the material cures
What Are the Rheological Properties of Rubber?
Many manufacturers focus only on final hardness, missing crucial information about how their rubber will process. This limited view can lead to production problems and inconsistent quality.
Rubber's rheological properties include its flow behavior under stress, its resistance to deformation, and how these properties change with temperature and time. These characteristics determine how well the material will process, mold, and perform in the final product.
In my discussions with quality managers, I emphasize how rheological properties affect every stage of rubber processing:
Key Rheological Properties
- Viscosity - Resistance to flow during mixing and molding
- Elasticity - Material's ability to recover from deformation
- Plasticity - Permanent deformation under stress
- Thixotropy - Change in flow properties with time and shear
- Temperature Sensitivity - How properties change with heat
What Is ML and MH in a Rheometer?
Confusion about ML and MH values can lead to incorrect process settings and quality problems. These parameters are fundamental to understanding your rubber compound's behavior.
ML (Minimum torque) represents the lowest viscosity reached when the rubber is hot but uncured. MH (Maximum torque) shows the final stiffness after complete curing. The difference between these values (MH-ML) indicates the degree of cross-linking in your compound.
Let me share what I've learned from helping customers optimize their processes:
Practical Applications of ML and MH
| Parameter | What It Tells You | How to Use It |
|---|---|---|
| ML | Processing ease | Adjust mixing conditions and processing aids |
| MH | Final product stiffness | Control cross-linking and filler levels |
| MH-ML | Cure degree | Optimize cure system and time |
| ML Stability | Process consistency | Monitor raw material quality |
| MH Stability | Product consistency | Control cure system activity |
Conclusion
Understanding rubber rheometer curves is crucial for quality control and process optimization. ML, MH, cure time, and curve shape provide essential data for consistent production and superior product quality.