Your viscosity readings are all over the place. This inconsistency wastes R&D time, causes product failures, and makes you doubt your entire quality control process.
To use a rotational viscometer accurately, you must control the variables. This means using the correct spindle and speed, ensuring a stable temperature, handling the sample properly, and performing regular calibrations. It's a system, not a single action.
I get calls about this all the time. A customer, maybe a purchasing manager like Jacky in Italy, will say, "Stefan, we bought one of your viscometers, but we measure the same adhesive twice and get different numbers. Is the machine broken?" Nine times out of ten, the machine is perfect. The problem is in the process. A viscometer is a precise instrument, and it will precisely measure the effect of even small changes. Let's walk through how to make sure those measurements are not just precise, but also accurate and repeatable.
Understanding Rotational Viscometers and Measurement Principles?
You see the numbers on the screen but don't know what they mean. This makes it hard to troubleshoot problems or trust your data for important decisions.
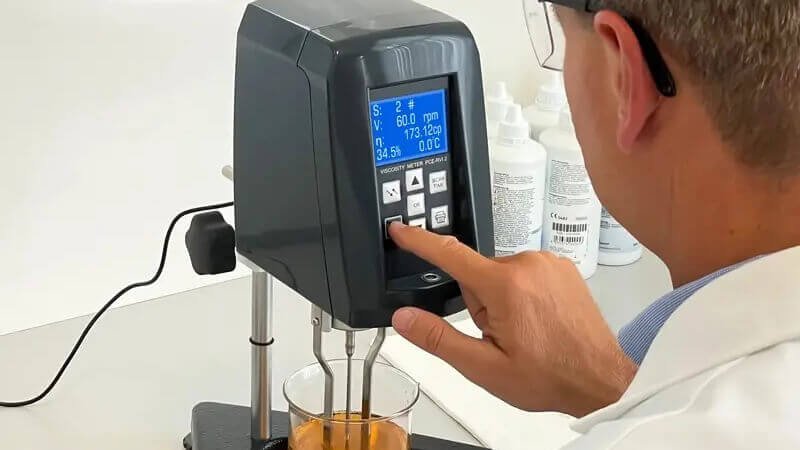
A rotational viscometer measures the torque (force) needed to rotate a spindle in a fluid at a specific speed. This relationship between torque, spindle geometry, and speed is used to calculate the fluid's resistance to flow, or its viscosity.
At its heart, the principle is simple. My company, Martests, designs these instruments to be robust and reliable. A motor turns a specific shaft, which we call a spindle. You immerse this spindle in your sample. As the spindle rotates, the fluid drags on it, creating resistance. The viscometer's sensor measures this resistance as torque. A thicker, more viscous fluid will create more drag and require more torque to keep the spindle moving at the same speed. The instrument’s software then takes this torque value, combines it with the known size of the spindle and its speed, and displays the result as a viscosity value, usually in centipoise (cP) or milliPascal-seconds (mPa·s).
How it Measures Viscosity
The core of the measurement is the relationship between the force you apply and the flow you get. A rotational viscometer does this in a very controlled way. You set the speed (which defines the shear rate), and the machine measures the resulting torque. It's a direct cause-and-effect measurement.
Key Factors That Influence the Reading
Accuracy depends on controlling everything that can affect this measurement.
| Factor | Why it Matters | How to Control It |
|---|---|---|
| Temperature | Viscosity is highly temperature-dependent. A change of just 1°C can alter viscosity by up to 10%. | Use a circulating water bath to hold the sample at a precise, stable temperature. |
| Spindle & Speed | These determine the shear rate. Non-Newtonian fluids have different viscosities at different shear rates. | Choose a combination that gives a torque reading in the "sweet spot" (usually 20-80% of the instrument's range). |
| Sample Handling | Air bubbles, inconsistent volume, or a non-uniform sample will create false readings. | Follow a standard procedure for loading the sample. Ensure it is well-mixed and free of bubbles. |
This is why we build our viscometers with precise speed control and offer accessories like temperature baths. We provide the tools for control.
What are Common Sources of Error in Rotational Viscosity Measurement?
You measure the same sample twice and get two completely different readings. This inconsistency makes you doubt your instrument, your sample, and your entire quality control process.
Common errors stem from three areas: the instrument (calibration drift, wrong spindle), the operator (air bubbles, incorrect sample volume), and the environment (temperature fluctuations). Time-dependent sample properties like thixotropy also cause variations if not managed.
I once visited a customer who was struggling with inconsistent results on their cosmetic creams. They were frustrated and ready to blame the instrument. When I arrived, I saw the operator was using a very small spindle at a very high speed. The torque reading was below 10%. This is a huge source of error. The instrument cannot be accurate at the very low end of its range. We switched to a larger spindle and a lower speed, which brought the torque to around 50%. Suddenly, their results were perfectly repeatable. It's often small things that make a big difference.
Instrument and Operator Errors
These are the most common and the easiest to fix. A viscometer is a mechanical device, and parts can wear or drift out of calibration over time. But more often, the error is human. Using the wrong spindle for the job, not filling the sample container to the correct level, or introducing air bubbles during loading are frequent culprits. I tell all my customers: write down a standard operating procedure (SOP) and make sure everyone follows it exactly, every time.
Environmental and Sample Errors
Your lab environment and the nature of your sample itself are also major sources of variation.
| Error Source | Description | Solution |
|---|---|---|
| Temperature Fluctuations | The sample temperature changes during the test, causing the viscosity to drift. | Use a temperature-controlled bath and allow the sample to thermally equilibrate for at least 30 minutes before testing. |
| Sample Non-Homogeneity | The sample is a suspension (like paint) and has settled, or it is an emulsion that is not uniform. | Ensure the sample is thoroughly but gently mixed before taking a measurement. Avoid creating bubbles. |
| Thixotropy | The viscosity changes over time after being disturbed. Measuring at 1 minute vs. 2 minutes gives different results. | Standardize the "wait time" between sample preparation and the start of the measurement. |
What are the Techniques to Optimize Measurement Accuracy?
You know that errors exist, but you are not sure of the exact steps to prevent them. This uncertainty means you are always reacting to bad data instead of producing good data.
To optimize accuracy, start with regular calibration using certified standards. Then, carefully select the right spindle and speed, ensure precise temperature control, and use a consistent, repeatable procedure for preparing and loading every sample.
Think of it like a recipe. If you sometimes use one egg and sometimes two, you will get a different cake. Viscosity measurement is the same. You need a strict recipe that defines every step of the process. This is how you move from inconsistent results to data you can trust to make business decisions. At Martests, we can sell you a viscometer, but the accuracy comes from the system you build around it. Let’s create that system.
Your Pre-Measurement Checklist
Before you press "start," run through this mental checklist.
- Check Calibration: When was the instrument last verified with a certified viscosity standard fluid? If it's been a while, run a quick check.
- Select Spindle/Speed: Your goal is to get a torque reading between 20% and 80% of the full scale. If your reading is 5%, you need a larger spindle or slower speed. If it's 95%, you need a smaller spindle or faster speed.
- Control Temperature: Is your sample at the target temperature? Not just the bath, but the sample itself. Give it time to equilibrate.
- Prepare the Sample: Look at it. Is it uniform? Are there bubbles on the spindle? A single bubble can ruin a reading.
Data Validation and Cleaning
Once the test starts, your job isn't over. Don't just accept the first number you see. Watch the reading for a minute. Does it stabilize, or is it drifting? A drifting reading tells you the sample is either not at thermal equilibrium or it's thixotropic. Take multiple readings and check for repeatability. If you get readings of 1000, 1010, and 1500, that last one is an outlier. Something went wrong. Finally, cleaning is part of the next measurement. I always tell my customers, "A dirty spindle from yesterday's test is the fastest way to ruin today's results."
What are the Advanced Approaches for High-Accuracy Results?
You have mastered the basics, but your complex materials like gels or coatings still show confusing behavior. A single viscosity number isn't telling you the whole story about performance.
For deeper insights, go beyond single-point viscosity. Use a rotational viscometer to create a flow curve that shows shear thinning, or measure yield stress to understand sag resistance. These advanced rheological tests provide a complete material profile.

A simple viscosity reading is like knowing a person's weight. It's useful, but it doesn't tell you if they are a bodybuilder or just overweight. A flow curve is like a full medical check-up. It gives you a much more complete picture of your material's health and behavior. Many of my customers, especially those in R&D, need this deeper understanding to solve tough formulation problems. Our Martests viscometers have the capabilities to perform these tests, turning a simple QC tool into a powerful research instrument.
Moving from Viscometry to Rheology
Your rotational viscometer is a basic rheometer. Instead of measuring at just one speed, you can program it to run through a range of speeds, from low to high and back again. This generates a flow curve (plotting viscosity vs. shear rate). From this single graph, you can see if your material is shear-thinning (viscosity drops with speed), which is critical for products like paint or ketchup. You can also see if it's thixotropic (the viscosity is different on the way up vs. the way down), which is important for leveling and sag resistance.
Real-World Application Case Study
This is where the data becomes powerful.
| Problem | Old, Ineffective Method | Advanced, Effective Method | Result |
|---|---|---|---|
| Paint is Sagging | "We measure viscosity at 10 RPM. The value is 5000 cP, which is our target. We don't understand the problem." | Use the viscometer to measure Yield Stress at a very low shear rate. | Discovered the yield stress was too low to resist gravity. The formulator added a different rheology modifier, solved the sag, and the single-point viscosity remained the same. |
| Cream Feels "Sticky" | "The viscosity is correct, but customers complain about the feel during application." | Run a Thixotropy Loop test (shear rate sweep up and down). | The test revealed that the cream's structure was recovering too slowly after being rubbed. This slow recovery felt like stickiness. A formulation change fixed the feel. |
These advanced tests directly connect a measurement in the lab to a customer's experience. This is how you innovate and create superior products.
Conclusion
Achieving accurate viscosity results is not magic. It is the outcome of understanding the principles, systematically controlling all variables, and following a consistent, repeatable process every single time.